
Overview
Qubole provides a Big Data on the cloud service. The main idea behind the product is to make data-driven insights easily accessible to anyone.
I head the design group at Qubole and am responsible for formulating the design strategy and vision, apart from being hands-on and designing key features. I recruited, manage and coach a 4 member team who are responsible for all design aspects of the data platform.
My ability to see the big picture while dwelling in the details allows me to execute tasks at any level of detail, guide the team towards the goal, set priorities and achieve business objectives with limited resources.
UX@Qubole
Since I joined my main task has been to reimagine the user experience of the platform to make it more simple, efficient, usable and modern.
Given the small team size, it was important to strike the balance between fixing the current interface and introducing new features. In order to address this, I quickly identified the major problem areas and divided them into 2 buckets:
- low hanging, short-term high impact fixes
- long-term strategic upgrades
This allowed for accommodating small changes in the sprints while focussing on working on new features in parallel.
UX Process
The team follows the typical Design Thinking process with a few additions to account for ease of use, constant improvement, simplicity and consistent end to end experience. The Stanford design thinking process starts at empathize and stops at test, but for a Product team, the process starts by keeping an open eye and doesn’t end until the product is released.

Notice & Empathize
Lets take the example of our Data Scientist (DS) users to understand the process.
Notice
Even before one can empathize with a user, a designer needs to have their eyes and ears open to all the information floating around them. Information can come by observing the real users, role playing, listening to field teams, looking at support tickets or deep-diving into analytics data.
Many a times noticing user behavior can provide great insights into the tasks a user needs to complete and if the platform provides that capability. While conducting a user study we observed that our DS users frequently switch between the platform and an IDE/CLI to get their work done.
Empathize: Personas
I already had personas created for our 4 main user types by working with our end users and internal teams. The design team used them effectively to draw attention to users frustrations and convert them into actionable feature enhancements.
However noticing DS users in their environment gave us insight into the need for a tool to version and deploy their models
-

- Data Scientist

-

- Data Engineer

-

- Administrator

-

- Analyst

Empathize: Journey Map
Journey maps are a creative way to map the users path in the product and understand their pain points as well as opportunities for improvement. The image shows the DS journey as they carry out the task to create ML models.

Market Analysis
Through the market analysis we realized that we were doing great at supporting DS users with their big data needs but needed to add functionality to support production level workloads for data modeling.
To create a differentiation and go beyond what any other tools provide, the team decided we needed the following,
- Organization of notebooks and assets
- Support data model creation workflows using a simple easy to use UI
- Provide a 1-click deployment function

Define the Problem
Allow Data Scientists to develop, version, export, monitor and deploy machine learning models on the platform.
Ideate
Based on the empathize phase and market research we started ideating ways to add the data modeling capabilities in our platform.
We first brainstormed the typical modeling process itself so that we could map it to the new workflow tool and come up with prototypes for the same.

Prototype, Test and Iterate
Based on the above, the larger team thought most of the workflow can be achieved by adding small features to the current UI, without having to invest too many resources which is always a premium. However, given the user behavior, the UX team was not sure if this will lead to adoption and differentiation. So, we created a quick wireframe by adding elements to the current UI and run tests with users.
To test the general flows without losing too much time, we tested with a few internal DS users. We found that,
- Advance DS users were comfortable with the approach but still wanted better organization
- However, DS users early in their career who were used to drag/drop tools had a hard time understanding on how the entire flow would work
Biggest learning from it was that we were proposing patch work thinking of constraints first rather than creating an end to end experience that even the most novice of DS users could use.
So we went back to the drawing board, dug deeper and created an end to end experience. We also realized that each phase of the workflow had an input area, a working area and an output area and the pages could be structured to make it apparent.
-

- Wireframe-projects
-

- Wireframe-create workflow
-

- Wireframe-prepare data

-

- Wireframe-build model
-

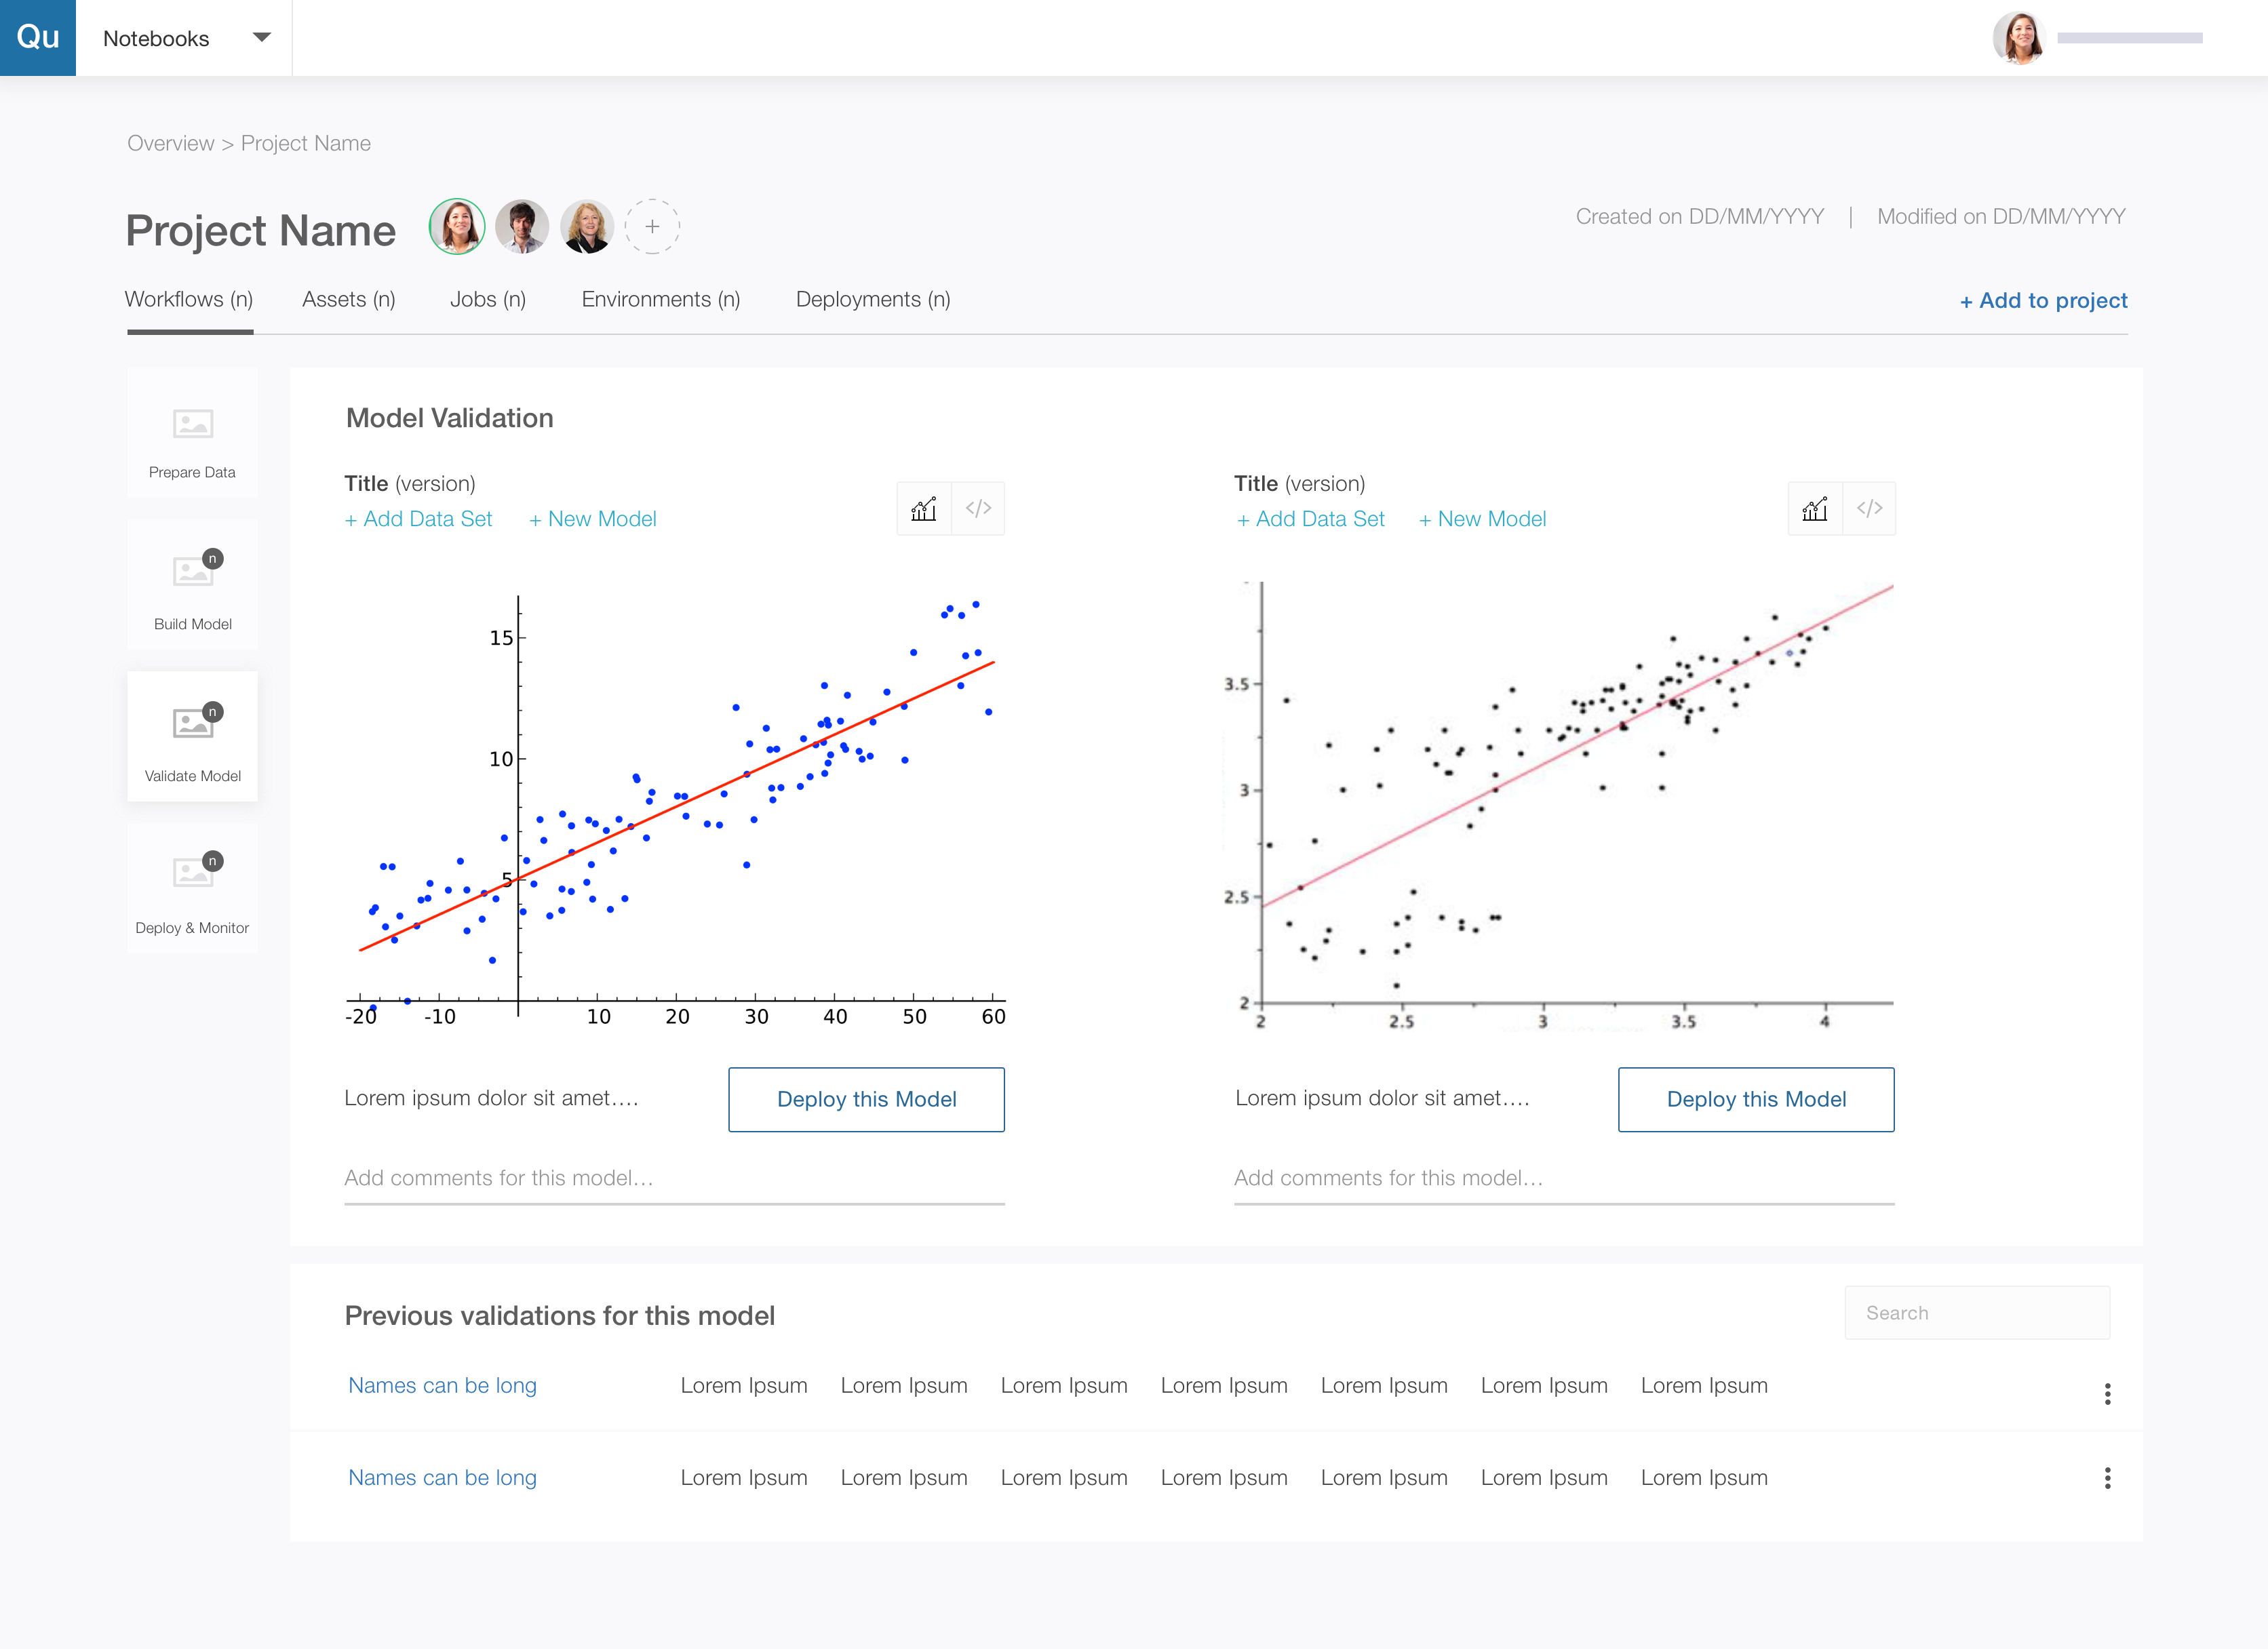
- Wireframe-validate model
-

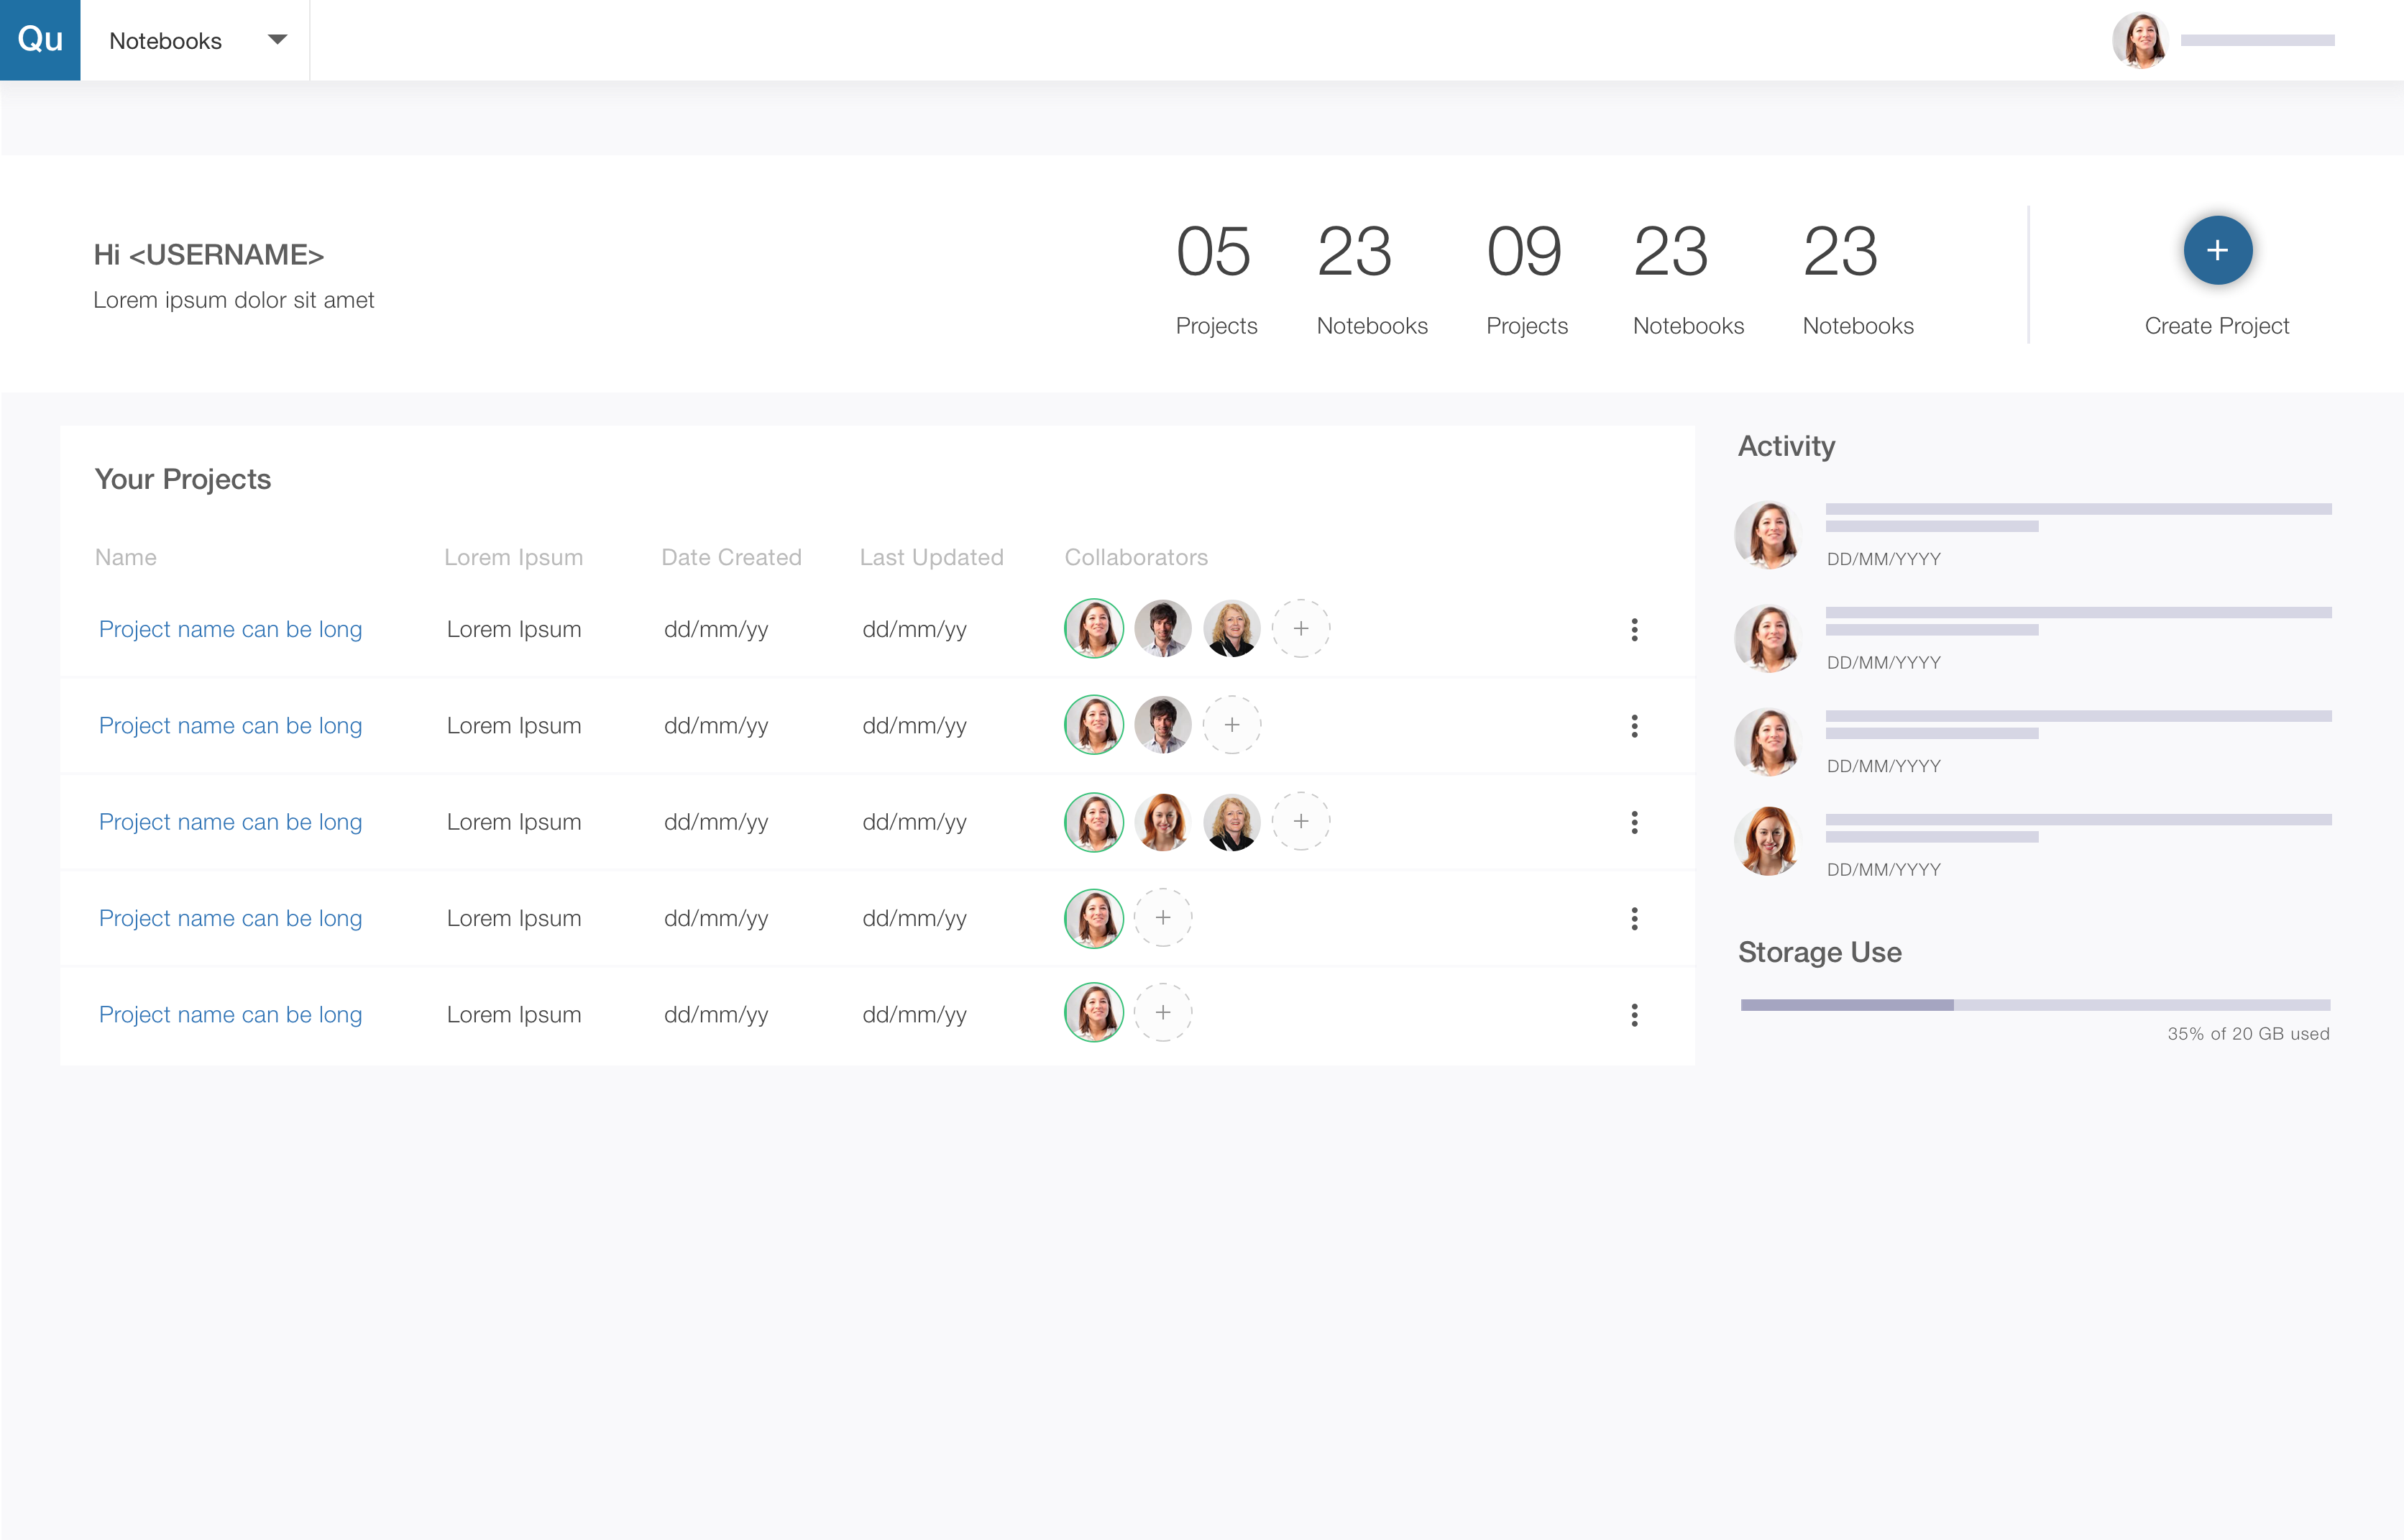
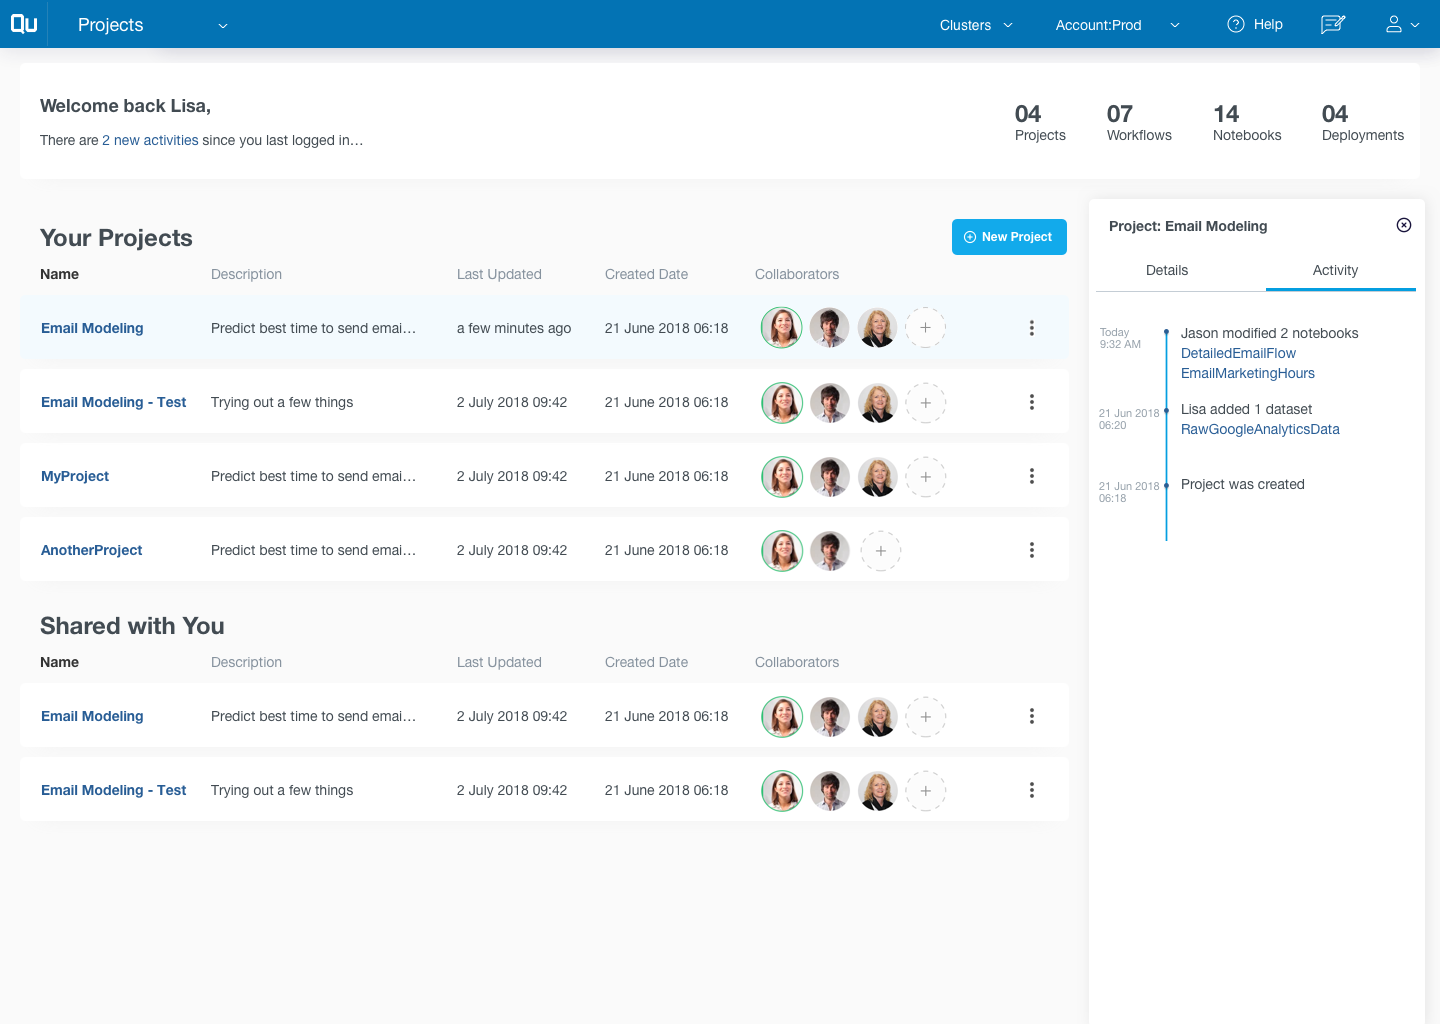
- High Fidelity-ProjectsList

-

- High Fidelity-ProjectsInformation
-

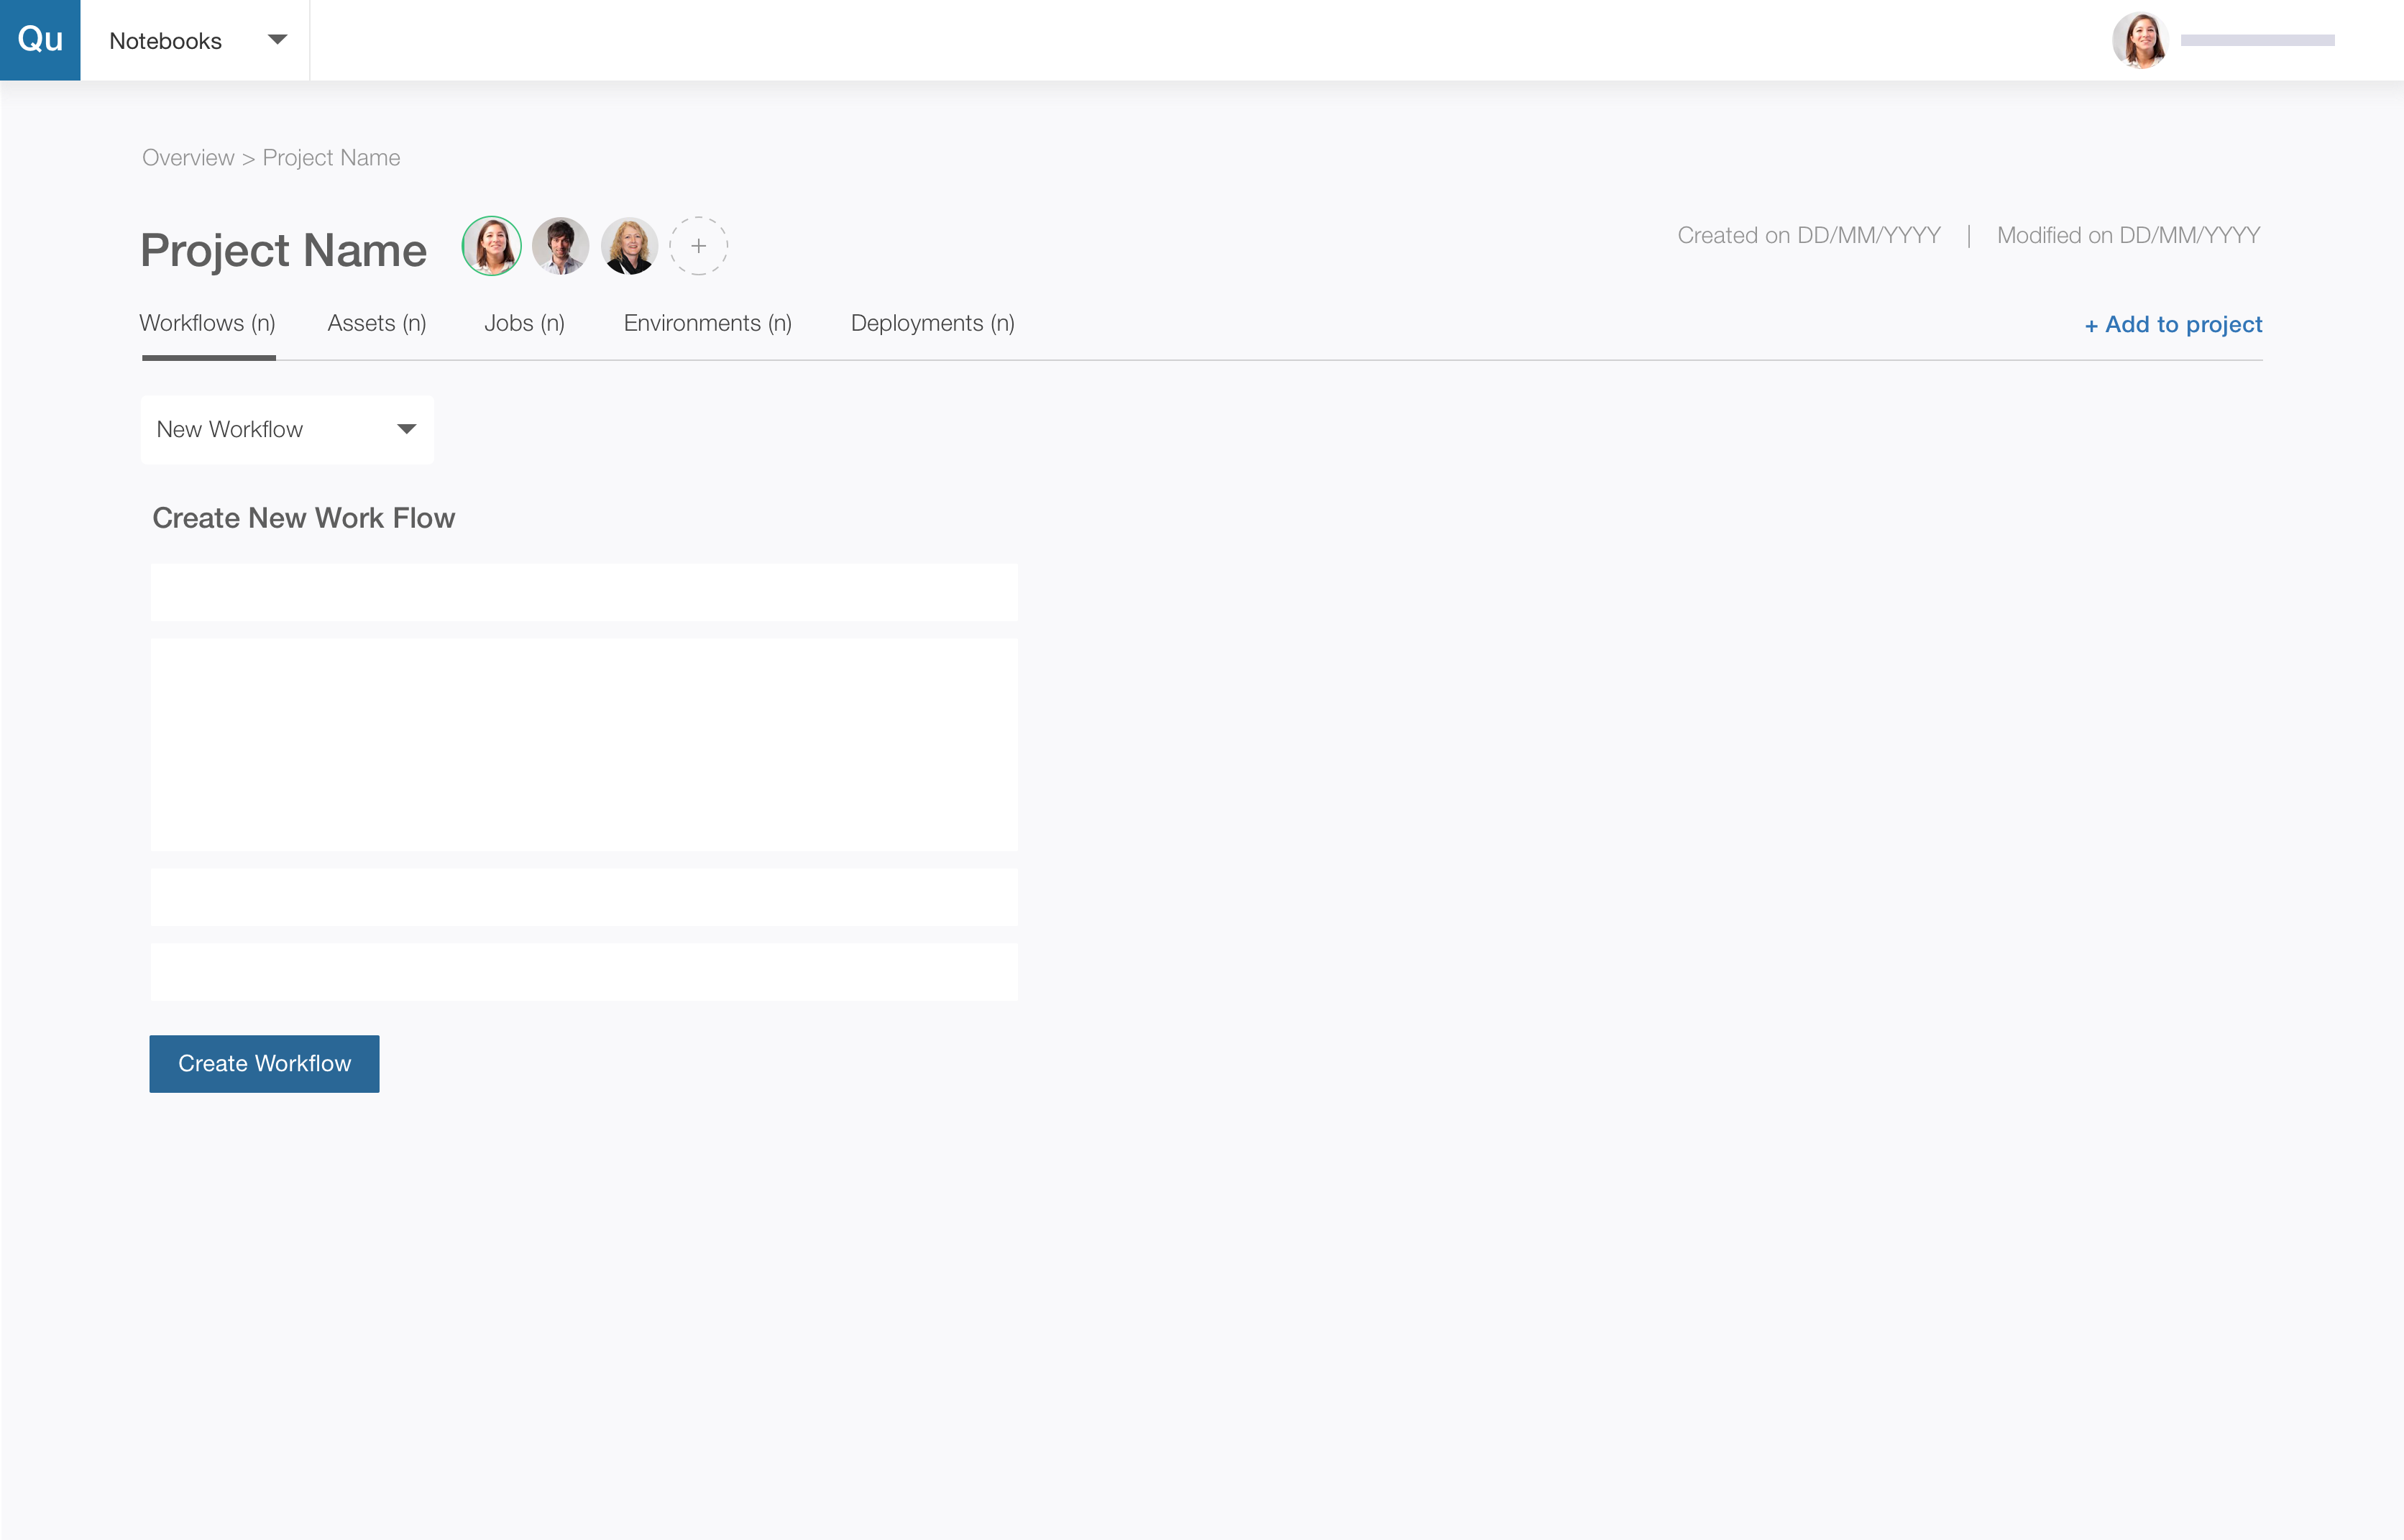
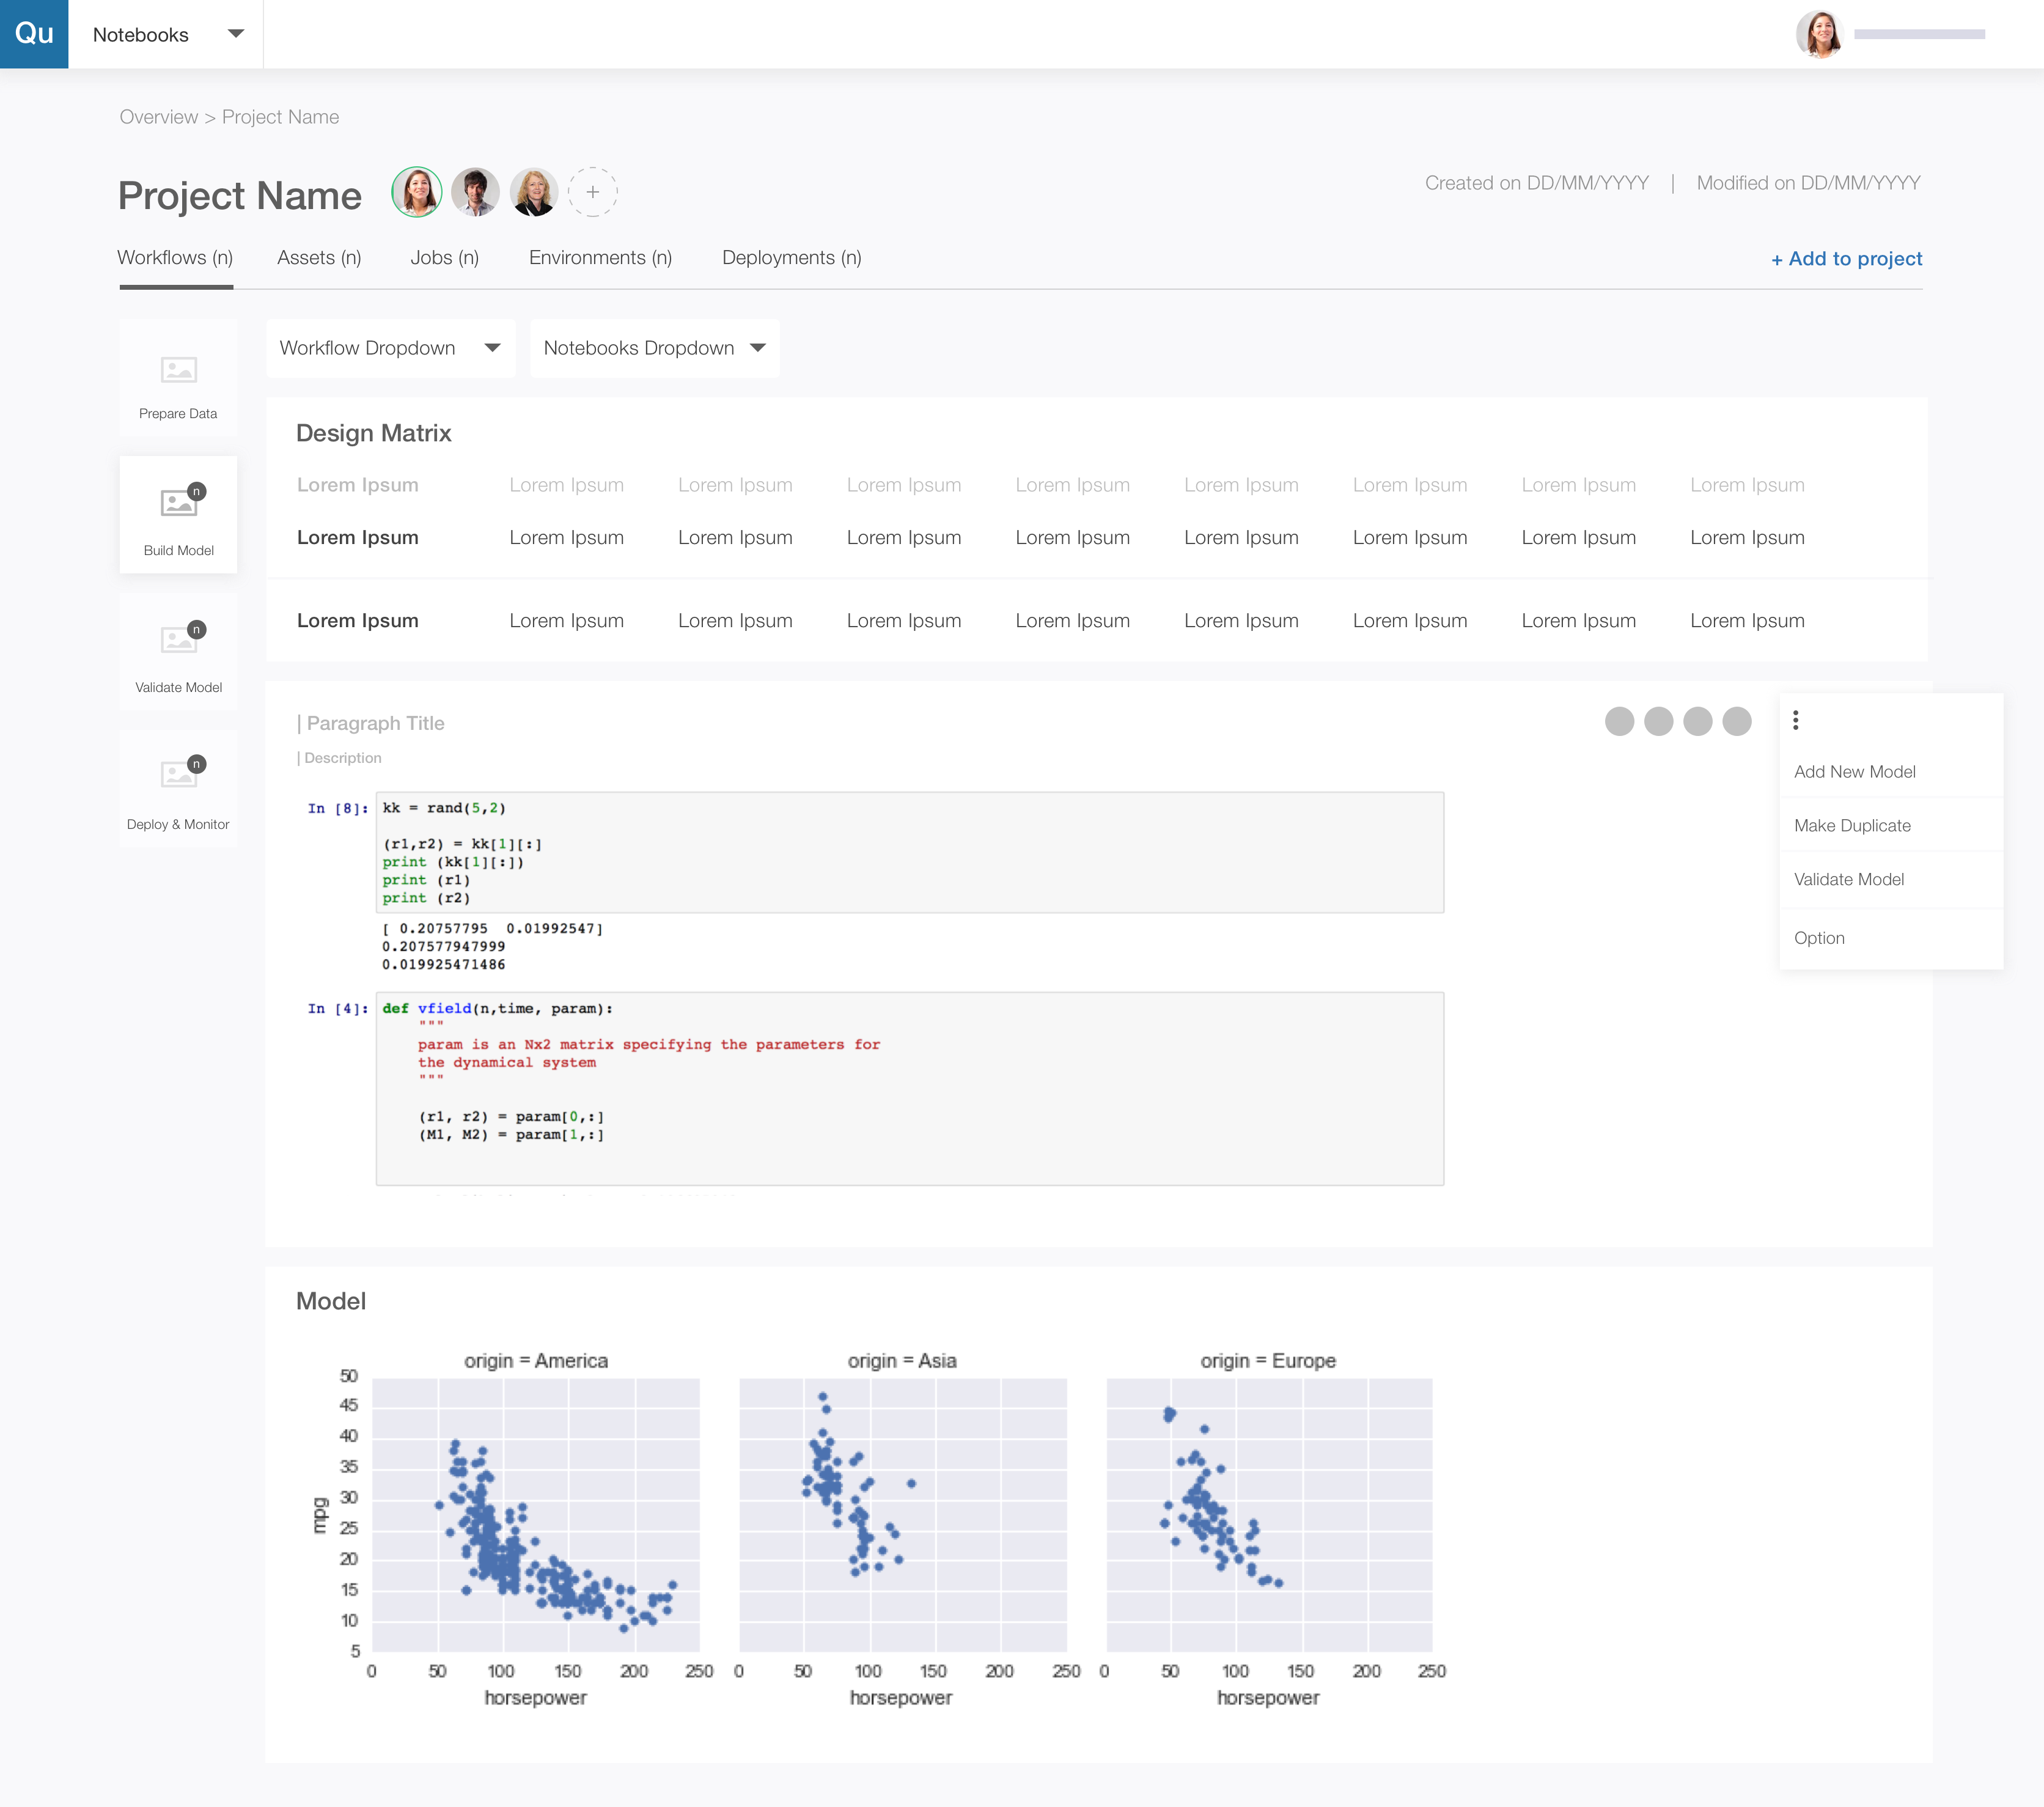
- High Fidelity-ProjectDetails

-

- High Fidelity-CreatingWorkflow

Usability Study
Qubole design team is small and agile. We leverage each others strength in the team to deliver exceptional experiences. As such, although the designers are embedded into vertical pods owning every aspect of the vertical from user research to mockups, when it comes to usability studies, a researcher from a different vertical takes over. This ensures 2 things,
- A designer’s biases having being working on mocks do not cloud the output of the usability study
- More importantly, it allows collaboration & trust building within members of the team
For this project, we ran remote usability studies over video conferencing, identified, documented and prioritized issues for easy consumption by the wider team.
The most critical issue we identified was the layout of the workflow creation steps which was not focussed and allowed a lot of exit points for the user. We iterated and instead created a more wizard like flow which not only created a clear step by step picture but also allowed us to embed in context help.
Develop & Launch
Develop and launch are the most critical aspect of the product development process that can make or break the first launch of the product. As a designer, we need to be on top and work closely with developers, review every detail with an eagle’s eye and make sure the design are being translated as envisioned. If the product is new feature, designers need to work with marketing teams to ensure the USPs that we identified during Market Research are clearly articulated.
After launch, it is important to track your best work through carefully defined success metrics. In this case, we were tracking adoption of the feature in terms of Monthly Active Users & Number of model deployments.
Next Steps
We continue to monitor the success metrics. Although we haven’t reached our desired level, we continue to experiment with ways to create the awareness.
Will be glad to share more updates!